


The Michael & Susan Dell Foundation is the organization that supports the Ed-Fi Alliance, which provides its data standards and API code for free. Ed-Fi has its data standard and technology suite through a network of universities, government offices, and software companies.
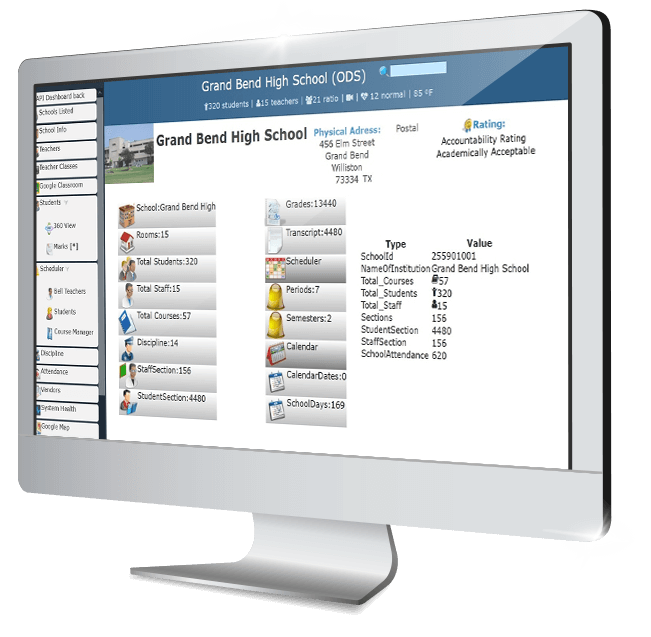
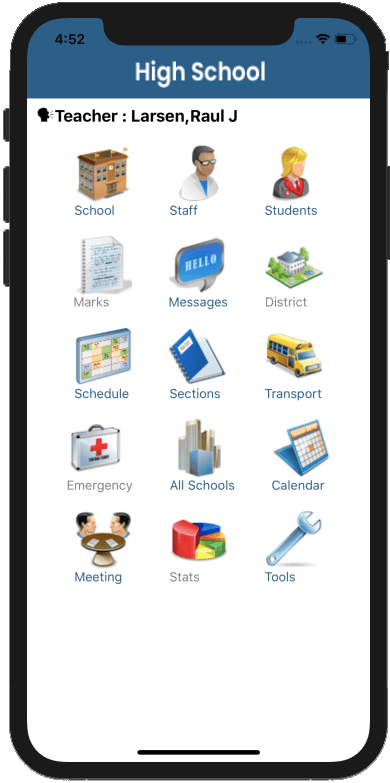
A dashboard powered by Ed-Fi gives teachers access to historical, current, and predictive data on all students. Teachers can use Ed-Fi Powered Dashboards to oversee student progress and respond to their needs all year round.
Teachers need to have current, applicable, and actionable metrics (measures of student achievement) at their disposal to comprehend a student's or a school's needs fully. The Edfi dashboard Metrics allow teachers to monitor students' progress, spot possible growth areas and early warning signs and take the necessary action to ensure that every student avoids failure and realizes their full potential.
The dashboards combine many important key metrics into simple, well-organized pages. The metrics provide an overall picture of a student's academic achievement, including test results, attendance information, and disciplinary occurrences.
These dashboards include metrics that campus officials and district leaders have identified as essential to carrying out their duties, as well as metrics that elementary and secondary teachers have found to be most helpful for determining a student's strengths and areas for improvement based on where they are in their education.
Research studies that have found the metrics or key indicators that will help educators forecast a student's future chance of success based on their current performance and analyses of quality standards by other states and districts have also validated these metrics.
To guarantee that teachers, administrators, and superintendents get the data they want at all levels of the PK–12 educational system, the student metrics start at the student level and are aggregated at the campus and district levels. The student Dashboard complies with FERPA. Instructors in charge of that kid may only view data on a student.
Knowing a student's overall demographics will help to ensure that interventions are appropriate for each student and that performance indicators are placed in the relevant context.
Educators unanimously agreed in focus groups from throughout Texas that a basic student profile was necessary before taking any action on a particular performance indicator.
Having this information at the beginning of the school year and getting updates throughout the year guarantees that educators, especially teachers and counselors, have a thorough understanding of their students and can plan the most effective instructional strategies and other necessary supports to ensure success.
Educators determined the following items to be important student knowledge:
- Demographics
- Info on enrollment
- Participation in programs such as career and technical education (CTE), English as a Second Language (ESL), bilingualism, and special education with specialized accommodations and Plan specifics
- Parent and student contact information
The dashboard provides the Principal with in-depth data about student attendance, helping the Principal make better operational decisions. The dashboard offers different viewpoints on Attendance Rate and Chronic Absenteeism, assisting the Principal in assessing the performance of the School and locating pupils who have a poor attendance record or are on the cusp of becoming chronically absent.